Published: July 22, 2026
Updated: October 1, 2026
|
There is a moment that every farm we work with hits in their first year with John Deere Operations Center. The setup went fine. The tractor is talking to the office. The mobile app is installed and shows the home fleet on the map. And then the actual question shows up: what do I look at every day, and when should I care about what it is telling me.
If you have a 100 to 500 acre farm and you set up Operations Center this spring, this is the post for you. Not the setup piece. Not the case study of what a 5,000-acre custom operator does. The working version, for the owner-operator or family farm that is running the system every day.
We already have a beginner's guide to Operations Center from summer 2025 that walks through the first setup steps. This piece picks up where that one ended.
The Five Screens You Should Care About
There are a lot of screens in Operations Center. For a small farm, five of them cover 90 percent of the useful daily and weekly work. Everything else is either edge-case or a paid PRO tier feature that most small farms will not use.
1. Home / Fleet screen.
Shows every connected machine, current location, running status, and any active alerts. This is the daily-glance view. If a tractor is where you thought it should be and there is no alert on it, you are done for the day on that machine. Total time cost: 30 seconds after morning coffee.
2. Machine Analyzer.
The individual machine health view. Fluid levels, hours since service intervals, current fault codes if any, recent utilization. This is the weekly view. What you want to see when you look at Machine Analyzer is nothing alarming and steady utilization patterns that match what you actually did that week.
3. Field Overview.
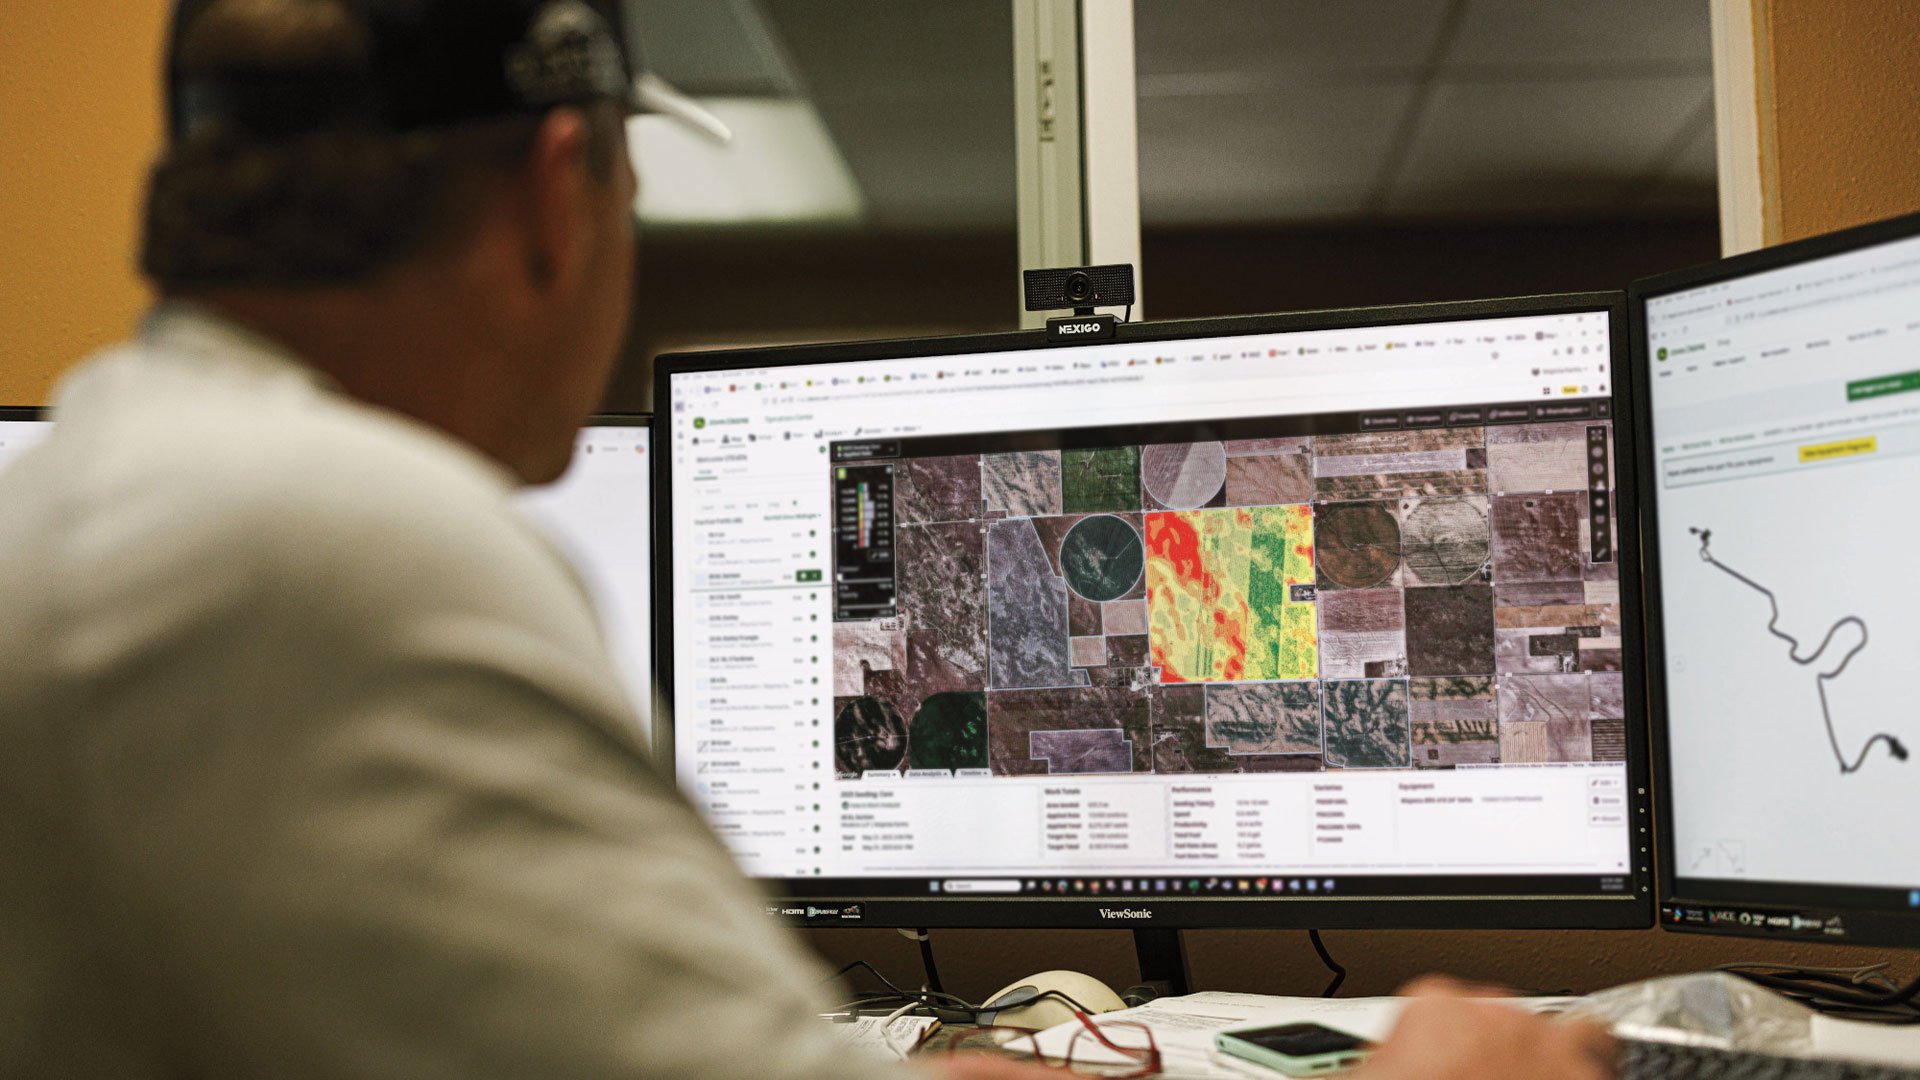
Maps of what got covered where and when. Tillage passes, planting passes, application passes, harvest passes. This is the seasonal view during active operations. What you want to see is uniform coverage without skips, without excessive overlap, and the right amount of ground per hour based on your machine and implement setup.
4. Field Analyzer.
The zoom-in on a single field. Yield map at harvest. Application rate variability. Depth variation across the field. This is the winter-review view. You are not looking at Field Analyzer every day of the season. You are looking at it in December to understand why one field yielded 40 bushels below the farm average.
5. Work Overview.
Task and work-order tracking across the season. Which fields have you covered, which are still to do, what the schedule was versus what happened. This is the planning view. Small farms often skip this in year one and start using it in year two once they realize it is where the season narrative lives.
That is genuinely it for a small farm running one to three connected machines. Everything else in the platform is either a specialty feature (livestock, custom application, work-order dispatch across a large fleet) or an integration you may set up later.
What fault codes actually mean, and when to worry
The single most common question we hear at the parts counter from farmers new to Operations Center is: my tractor threw a fault code and I do not know if I should panic. Here is the practical framework.
Diagnostic Trouble Codes (DTCs) in Operations Center come in two flavors. Amber (warning) and red (stop). The color is the first cue.
Amber codes typically mean "condition detected, continue with caution, plan a service visit." Examples: DEF (diesel exhaust fluid) low, hydraulic filter restriction increasing, particulate filter regeneration required. You can typically finish the field with an amber code, but you should not ignore it into the weekend.
Red codes mean "stop the machine now." Examples: engine oil pressure lost, coolant temperature critical, transmission fluid critical. Red code equals shut it down, do not restart, call service.
The trap most operators fall into is dismissing repeated amber codes because they never turned red. Amber codes are the machine telling you something has drifted. Ignored for weeks, they become expensive red codes. The right cadence is: an amber code on a machine you use daily should be resolved within a week. Machine Analyzer's fault history view shows you the pattern over time so you can see whether a code is a one-off or a growing issue.
If you are not sure what a specific code means, our service department can look up the code by number in about two minutes. Do not wrestle with it — call.
Reading a coverage map without overthinking it
Coverage maps in Field Overview show where the machine actually went, with color coding for pass overlap. This is the single most useful visualization in the platform for small farms, and it is also the one operators most commonly misread.
Three practical things to look for after a tillage, planting, or application pass:
- Skips.
- Areas the machine did not cover. Usually caused by GPS drift, guidance line calibration, or operator inattention around obstacles. A single small skip on the edge of a field is normal. A pattern of skips through the middle is a guidance issue that needs attention.
- Excessive overlap.
- Darker bands where the machine covered the same ground twice. Some overlap on turns is normal. Overlap in the middle of runs means the guidance is drifting or the swath width is misconfigured for the implement.
- Speed variation.
- Speed heatmaps show where the operator slowed down. Slow patches often indicate soft ground or an operator navigating an obstacle. This is not a problem by itself but it is useful ground truth for planning next year's pattern.
The mistake we see most often is a farmer looking at a coverage map after harvest and worrying about a pattern that has an entirely reasonable explanation. The map is a data point. It's not the whole story.
Cross-reference against what actually happened that day in the field before you decide anything is wrong.
Mobile vs desktop: When to use which device.
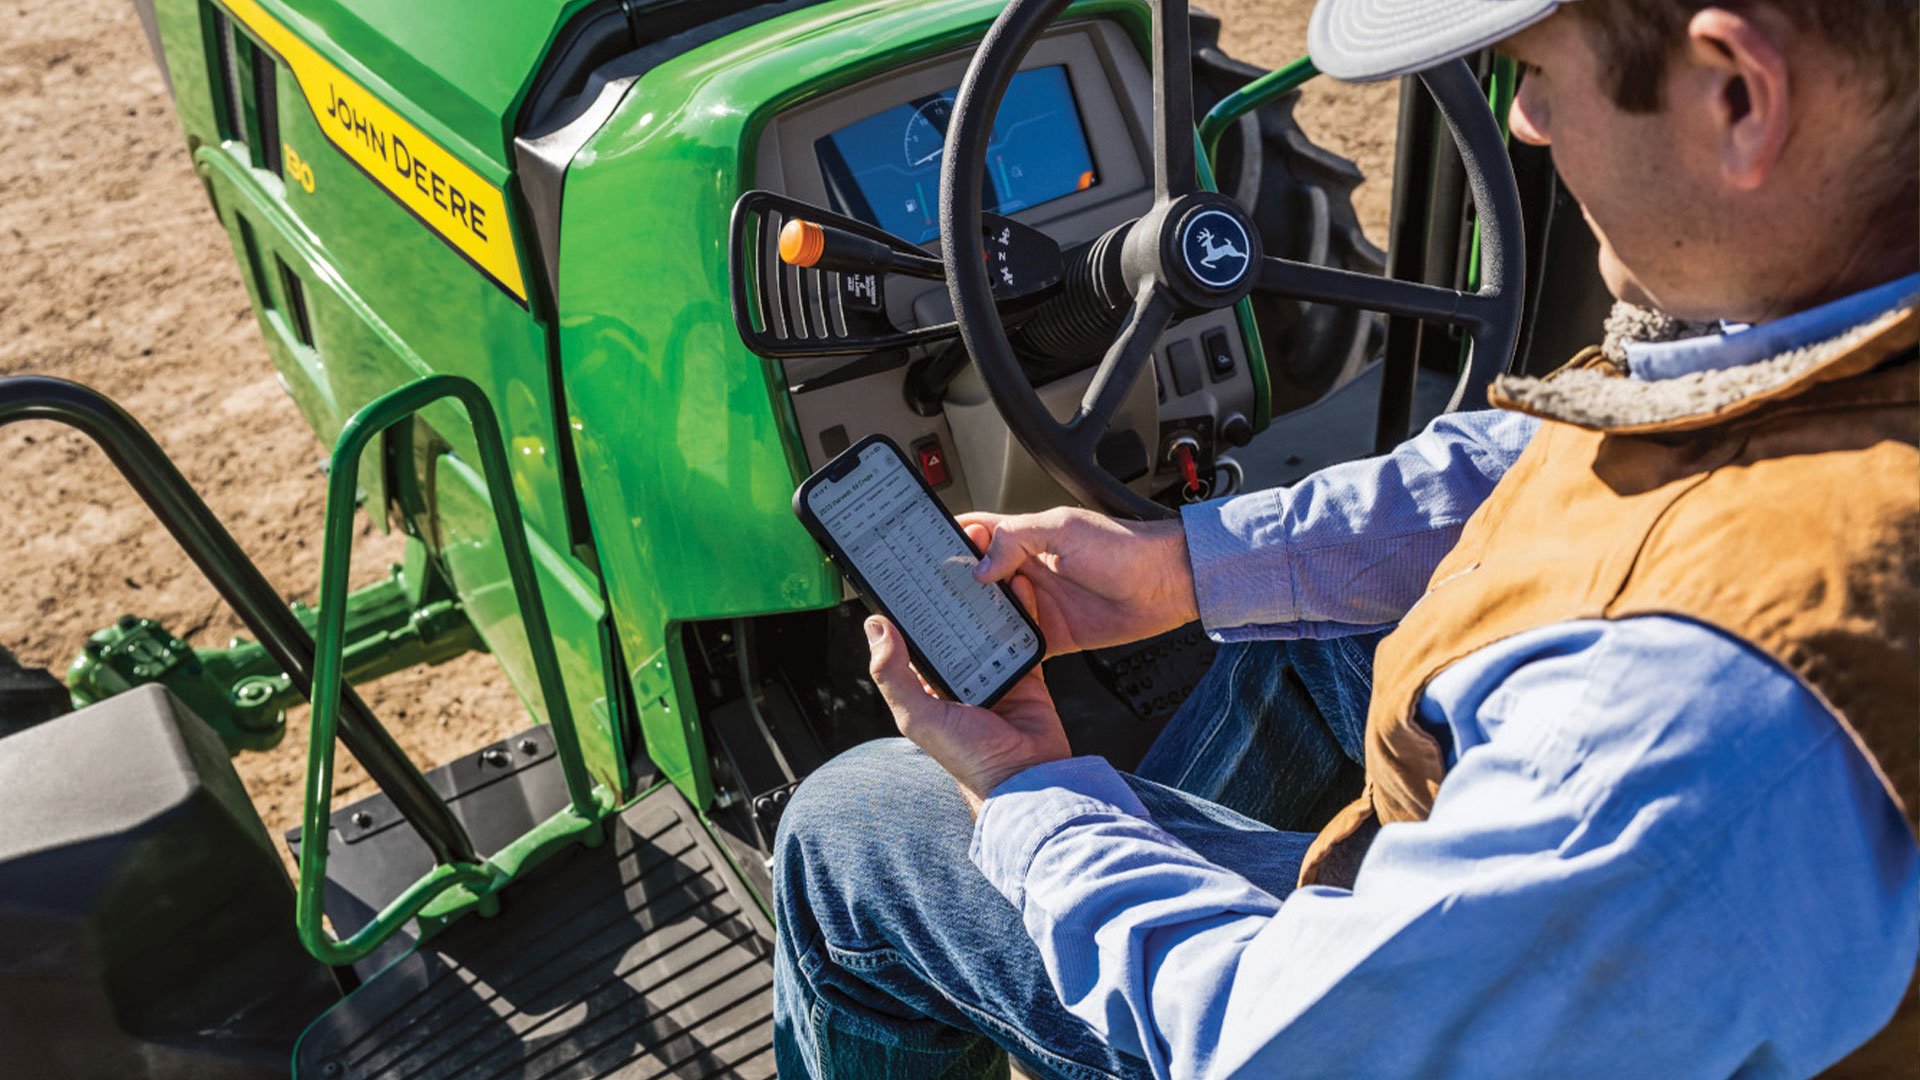
The Operations Center mobile app and the desktop web version are the same account and the same data, but they are not the same tool.
Mobile app is the right tool for:
-
Morning Home screen check while pouring coffee
-
In-cab alert monitoring during the day
-
Marking a field task complete after finishing it
-
Checking fuel levels or an amber code from the truck when you are out running errands - Looking at a machine location or path from wherever you are
Desktop web is the right tool for:
-
Reviewing coverage maps after a day's work
-
Field Analyzer deep-dives on yield data
-
Setting up prescriptions and boundaries
-
Building and adjusting work orders
-
Anything with a big screen and a mouse
We see small farm operators typically live in the mobile app for 90 percent of interactions and touch the desktop once or twice a week for the reviewing work.
The connectivity hardware behind all of this
Operations Center does not work unless your machines are connected. Simple as that.
JDLink R Modem 4G is the modem installed on new John Deere machines. It provides the cellular connection back to Operations Center for machine location, usage data, and diagnostics. If your machine came new from a dealer since roughly 2020, it has this modem or its predecessor built in and configured for you.
JDLink M Modem is the lower-cost telematics option for machines where the R Modem is not the right fit.
JDLink Boost Kit is an aftermarket upgrade for older machines that did not ship with connectivity. This is the answer for the farm that wants to bring a 2015 tractor into Operations Center without trading it in.
If you have an older machine you would like to see in Operations Center and it is not showing up, this is often the missing piece. Your Koenig team can install a Boost Kit or check on the R Modem status on any machine you own.

What Field Analyzer tells you in December
The single highest-value screen in Operations Center for small farms is Field Analyzer, and it is the one most under-used in year one.
Field Analyzer overlays yield data, application data, planting data, and topography on the same field map. When you sit down in December and look at a field that yielded 40 bushels under farm average, Field Analyzer can typically tell you why in 5 to 10 minutes:
- Was the planting rate different in that low-yield zone?
- Did nitrogen application actually happen at the rate the record says?
- Is there a topography pattern (wet spot, slope) that correlates with the low zone?
- Was the planting date meaningfully later in that field than the rest of the operation?
For a small farm making next-year planting decisions with real dollars on the line, Field Analyzer is where the decisions actually get made. Winter is the right time to build this habit.
The paid PRO tiers
John Deere sells several PRO-tier add-ons to Operations Center. The two most-marketed are PRO Service (an annual license focused on advanced diagnostics and machine health) and PRO Dispatch (work-order and dispatching for mixed fleets, oriented at custom applicators and large operators).
For a 100 to 500 acre small farm running one to three machines, neither PRO tier is typically the right buy. The base free tier of Operations Center is more capable than most small farms fully use. Buying PRO tiers before you're fully using the free tier is a common early enthusiasm mistake but that's something our team can help you through.
The exception is if your farm is doing meaningful custom work for neighbors. PRO Dispatch pays for itself quickly the moment you are managing work orders across multiple customers.
Common mistakes small farms make in year one
A short list of things we see repeatedly, and how to avoid them.
Setting up prescriptions but not verifying them in Field Analyzer after the pass
A prescription is a plan. Field Analyzer is what tells you whether the machine actually executed it. Trust but verify every prescription in the first year.
Ignoring amber codes because "it's still running."
As covered above. Amber codes are drift signals. Address them.
Not connecting a phone or tablet to the operator seat.
Alerts you cannot see in real time do not help. Mobile app in the cab, always.
Skipping the winter Field Analyzer review.
The data you collected all year is only worth something if you sit down with it after harvest. Block a Friday in December for this.
Our Precision Tech Team is Here and Prepared to Help
Two practical notes.
If you set up Operations Center and it is not showing what you expected, come see us. About half of the "Operations Center is not working right" service tickets we see turn out to be a JDLink modem configuration issue, a subscription status question, or a boundary setup problem. Any of those we can fix in under an hour.
If you're looking at a fault code or a coverage map and are not sure what it means, we can walk through it with you. This is exactly the kind of support conversation our service department is set up for.
Similar related posts
If you have not yet finished the initial setup, start with the beginner's guide to Operations Center from summer 2025 and our complete setup guide for JDLink from fall 2025. Once you are past setup and are working with the platform actively, our June 2026 AutoTrac practical first-time user guide covers the guidance system side of the equation, and our June 2026 pre-harvest combine inspection piece shows how Operations Center data drives the pre-harvest walkthrough.